The Plant
As your engineers see it
All Equipment, Connected
From the tower to the flange.
With Flow Context
At the scale of the plant.
Enrich with Knowledge
Create a trusted source.
The PlantGraph
A unified model you own.
The Unified Model for Industrial Plants
One model of your plant, for every engineer, app, and agent.
Cerebre creates a living model of your plant, captures engineering knowledge, and connects live data, so you can make better decisions.
Trusted by enterprises

The problem
Each piece of software holds a partial view with no model that unifies them.
The context needed to drive every decision at a plant, is siloed across drawings, bespoke applications, and in the heads of your smartest people. Nothing is retained in context to the plant itself.
Applications cut off knowledge.
-01-
Every application locks in plant knowledge against a proprietary structure. Limiting future use and reusability. Digital teams are handcuffed to existing application capabilities.
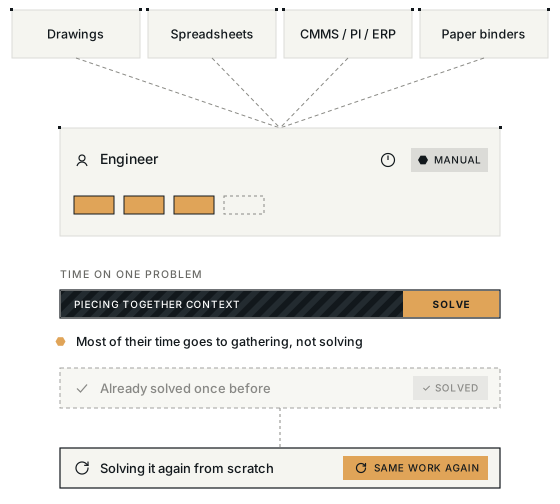
Engineers waste time filling in gaps.
-02-
Engineers spend most of their time piecing together the picture needed to solve a problem. Worse, the problem has often been solved before.
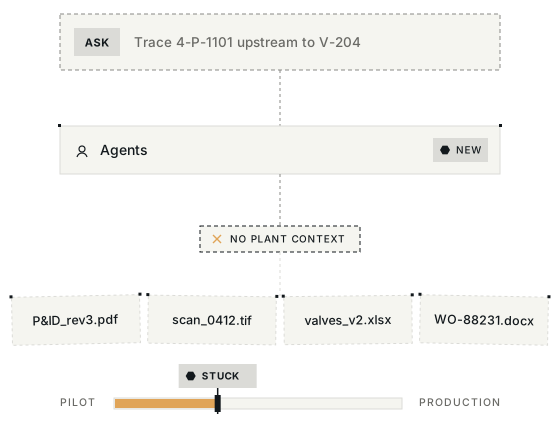
The same gap exists for Agents.
-03-
Agents can't reason over unstructured plant context, which is why they never make it out of pilot.
50+%
of experienced engineers plan to retire within the decade. (OrionJobs)
Only 27%
of enterprises are satisfied with AI ROI with 70% stuck in pilot purgatory. (McKinsey & DXC Technology)
PlantGraph
One plant, many lenses.
PlantGraph turns your existing drawings, data, and knowledge into a unified model of the entire facility, from the tower to the flange, including how material and energy flow between equipment. One model for every engineer, analysis, and agent to work from.
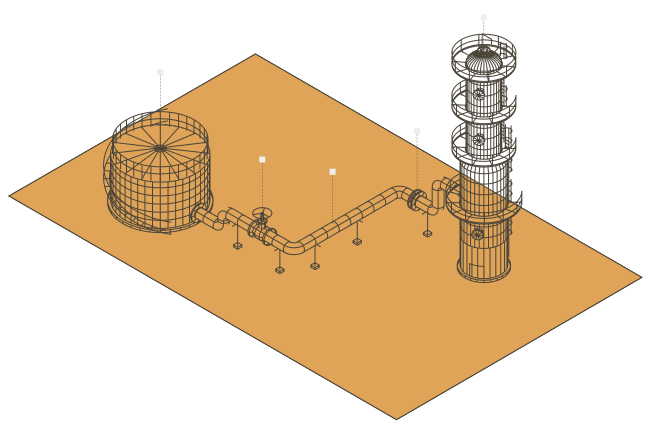
The whole plant, connected.
Search flow across your entire plant. Pick any two points and see every line, valve, and flange between them, across every drawing.

Find anything.
A search engine for your plant. Search all your data through the lens of the plant, so every result shows up in the context of the equipment and flow around it.
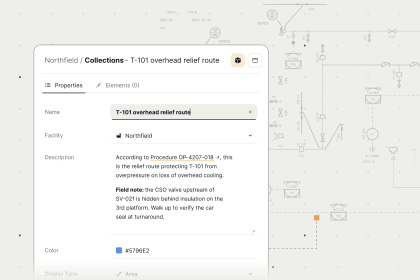
Add what you know.
Define control loops, build isolation plans, map systems, capture field notes, etc. right inside the model. And when you do, everyone else can find them.

It looks like your plant.
Use the same CAD symbols and diagrams engineers already use, the configuration of the equipment, and the orientation of where they are relative to each other.
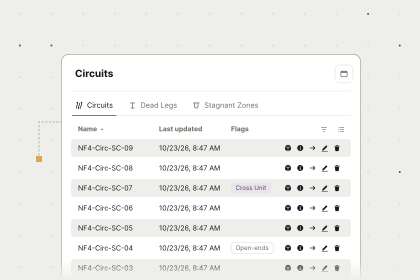
Always current.
When the plant changes, PlantGraph changes with it, and so does everything your teams have added. Loops, circuits, notes, and plans stay accurate and versioned, so knowledge never goes stale.
One model under every tool.
A unified, real-time model of the plant feeds every application, analytics project, and AI agent you run. Your engineers’ knowledge shows up in any tool, every capability can reason over the whole plant, and everything new builds on the same foundation instead of starting from scratch.
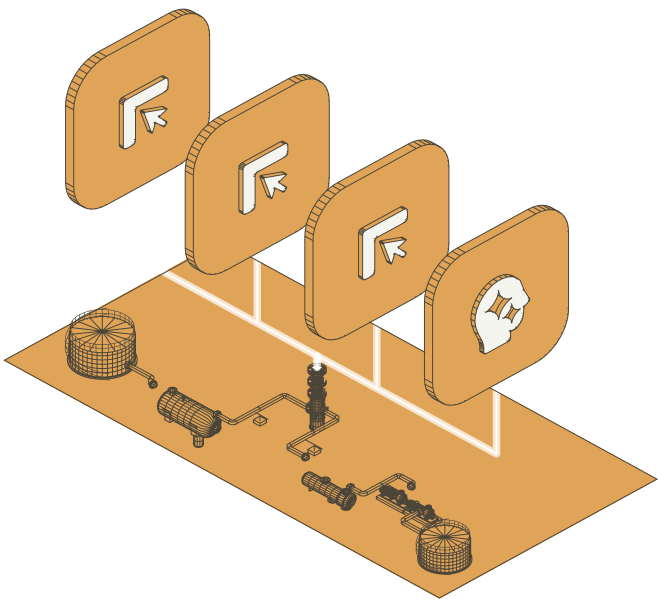
The difference
Not a data aggregation platform, not a workflow platform, not another model. The whole picture.
Platforms connect data to things and build context on top of this. Cerebre models the plant itself - equipment, flow, and engineering concepts. That's why every answer comes back with the context of the plant.
Others
Digital twins model visually.
Data platforms make data reachable.
Ontology tools model data.
PlantGraph
PlantGraph models what connects to what, and what that connection means.
PlantGraph puts that data in context, so you see it through the lens of the plant.
PlantGraph ties your knowledge to a ground-truthed model of how your plant is actually configured.
Built for enterprise reasoning
Reason like your best engineer.
Cerebre serves your plant model to the agents, models & tools your team already uses. With an ontology that turns equipment, lines, & data into the concepts your engineers know and that agents can understand. So your agents have the context to reason: trace upstream & downstream, pull in work orders, procedures and live data, with your permissions carried along
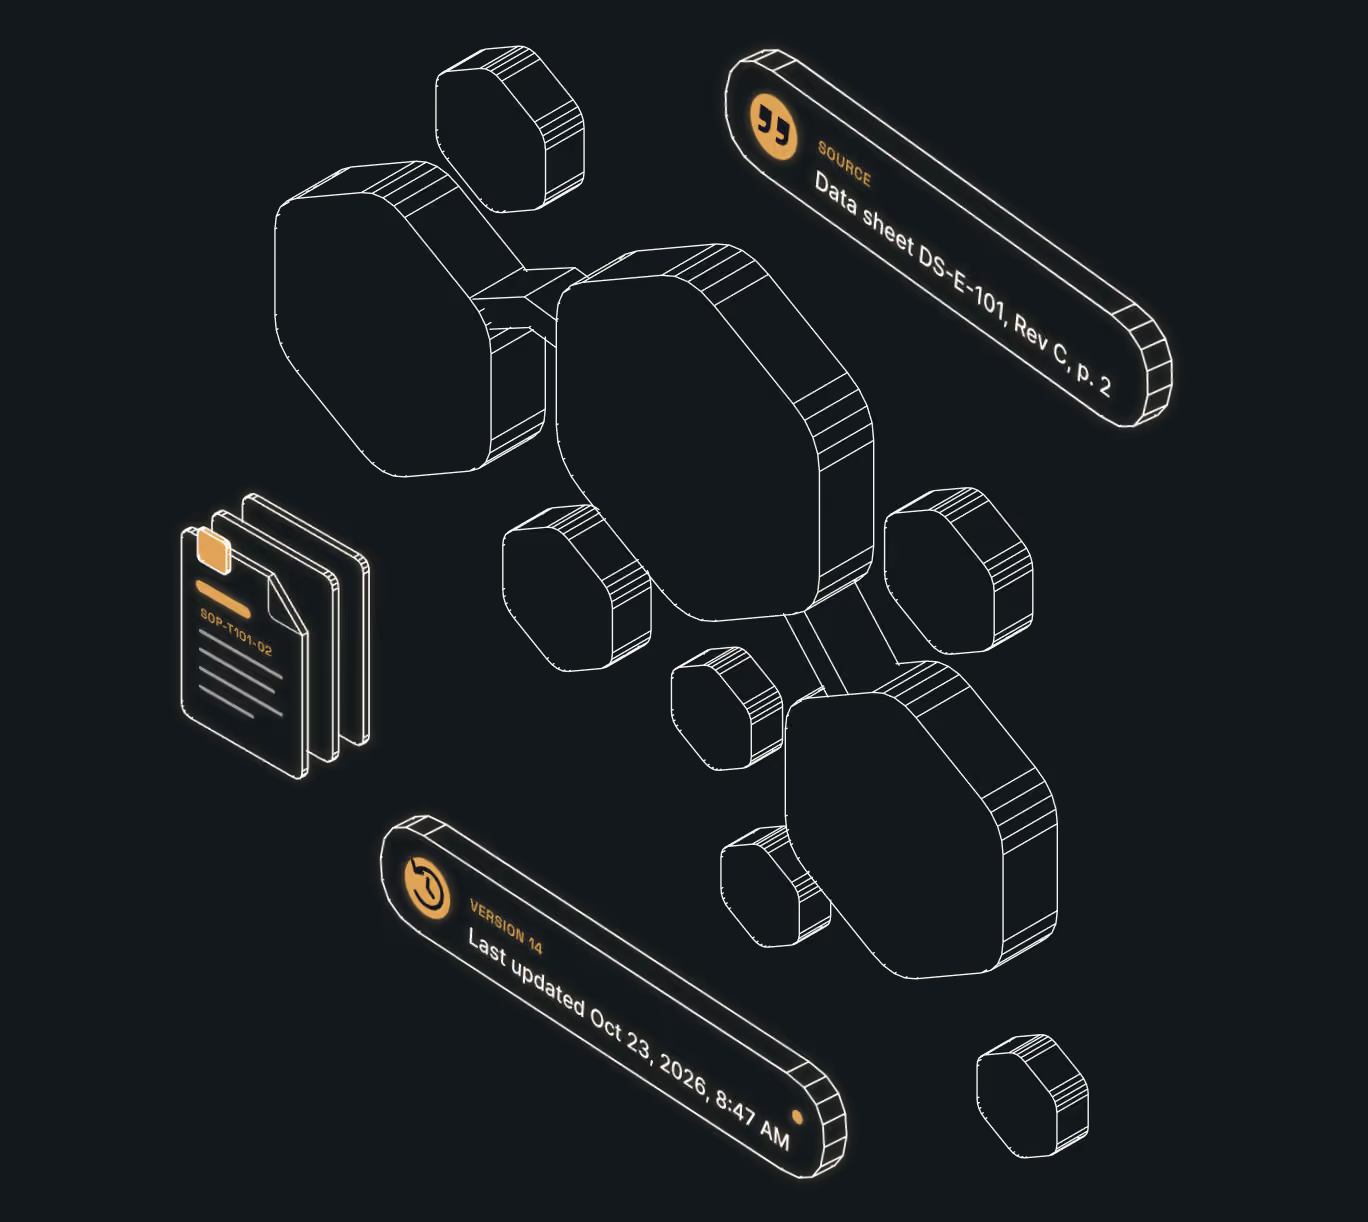
Every answer cites its source
Grounded in your plant, not the internet
Versioned, so you know what changed and when
Customers
Scaling with the largest operators in the world.
PlantGraph underpins hundreds of upstream, midstream, and downstream assets of industry leading owner / operators.
200+
Plants Modeled
150,000+
Schematics
1B+
Usable context nodes
Thousands
of engineers every week

A digital backbone for the enterprise.

Enhancing operational efficiency, safety, and decision-making across upstream, downstream, and midstream.
“Cerebre is in the business of scale. You build for the enterprise, not for one-offs."
Lift %+
Lorem Ipsum

Lorem ipsum dolor sit amet.
Lorem ipsum dolor sit amet, consectetur adipiscing elit. Aliquam cursus lectus elementum nulla porta cursus ut ut justo. Quisque viverra.
“Lorem ipsum dolor sit amet, consectetur adipiscing elit.”
Lift %+
Lorem Ipsum

Lorem ipsum dolor sit amet.
Lorem ipsum dolor sit amet, consectetur adipiscing elit. Aliquam cursus lectus elementum nulla porta cursus ut ut justo. Quisque viverra.
“Lorem ipsum dolor sit amet, consectetur adipiscing elit.”
Leadership
The Team

Jeff Robbins
Founder and CEO
Solves industrial digitization's hardest problems - sensors, then data, now context.
Jeff has built digital solutions on sensor data, designed marketplaces to connect loT data, and built the Al systems that ran on top of it all. He founded Cerebre to solve the piece still missing underneath every one of those systems: the context that makes Al useful in a plant.

Rob Povey
CTO
Invents the knowledge graph technology industrial scale requires.
Rob built Microsoft Bing's knowledge graph, then Maana's industrial knowledge graph platform, before Cerebre. He's built the largest knowledge graph deployments in the world, and is doing it again, at plant scale.

Lewis Makin
CRO
Codifies engineering knowledge most companies lose.
Lewis has built reliability strategies and deployed plant- wide operating systems from the inside - he knows firsthand how the knowledge that keeps a plant running usually stays locked in one person's head, and how to get it out.

Sam Korach
COO
Keeps disruptive companies running in industries built to resist them.
Sam has run public-private partnerships, VC hubs, and innovation programs, and held product roles across fast- growing companies. He knows how to take an early- stage company through the operational stages that challenge most of them.